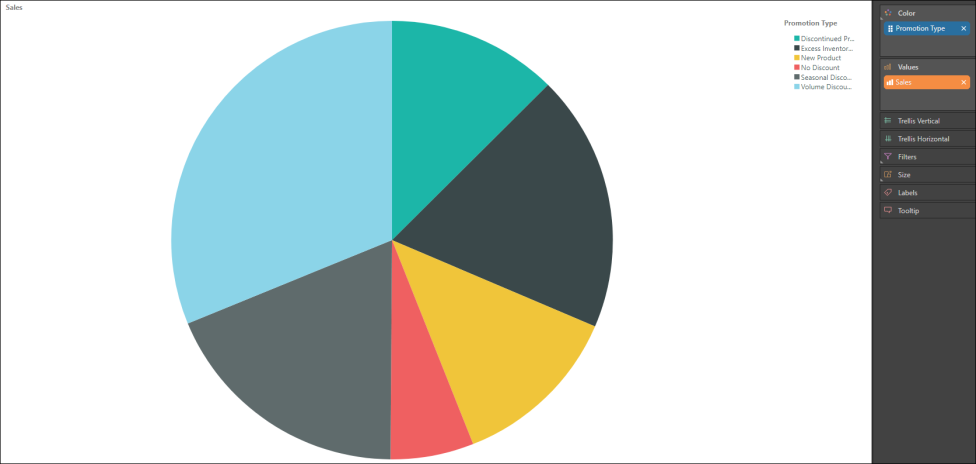
Pie charts are a good way to visualize percentage or proportional data when you're comparing only a few elements. The pie chart represents the given member hierarchy as colored segments of a whole; the segment color is driven by the member hierarchy, while the segment size is driven by the measure.
Build a Pie Chart
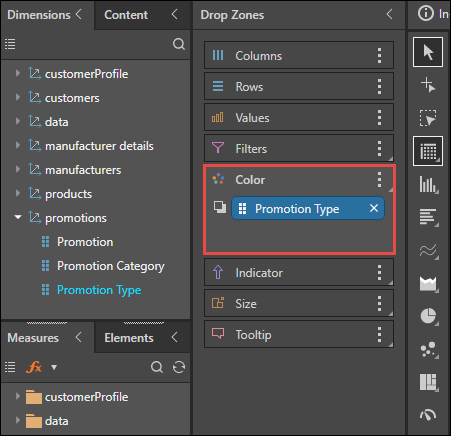
Step 1
Add the required member hierarchy to the Color drop zone (red highlight below).
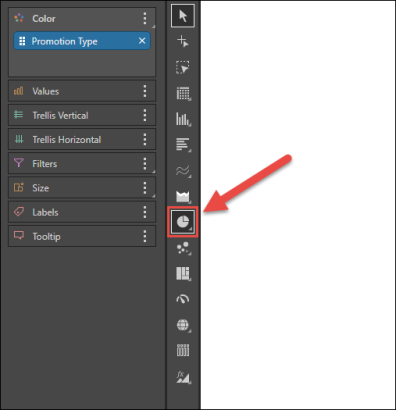
Step 2
Select Pie Chart from the visualization menu.
Step 3
Add the required measure to the Values zone.
